Our Star
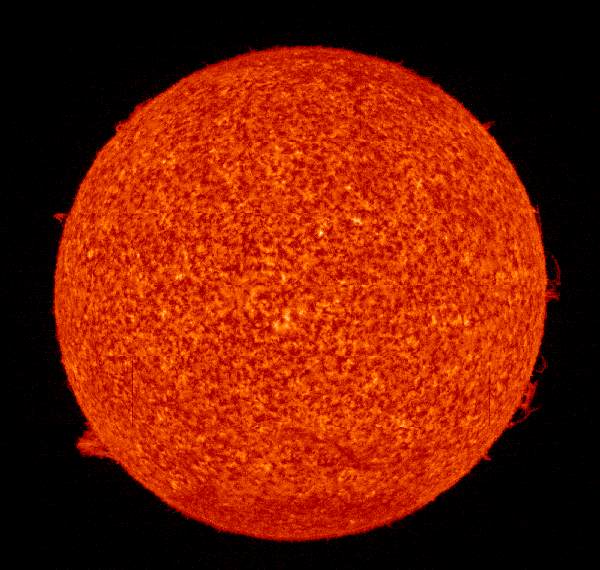
The Sun observed by SUMER (Ultraviolet Measurements Of Emitted Radiation) in the emission line of He I at 584.3 Å, formed in the upper chromosphere at about 20,000 K.
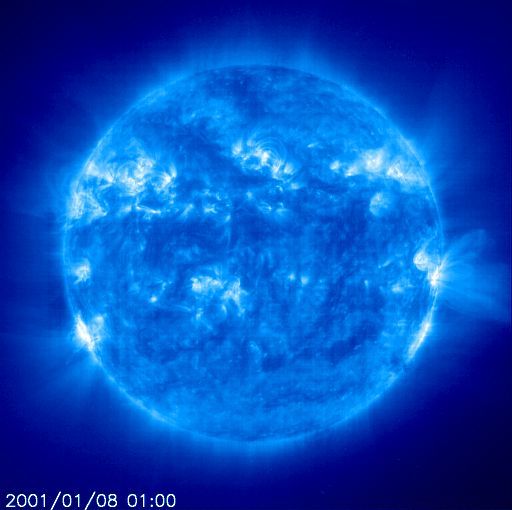
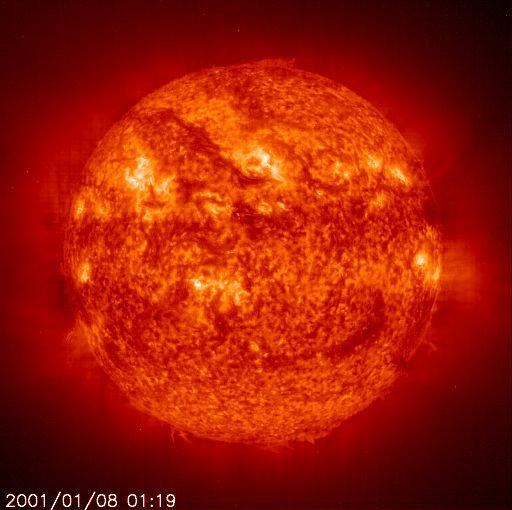
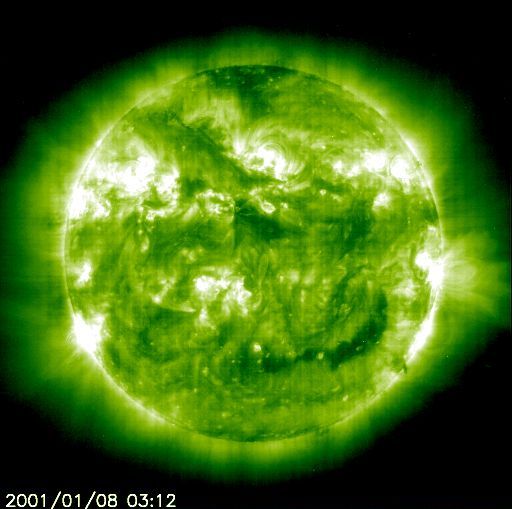
The Sun at 3 Different Wavelengths
Each of the three images represent the emissions of a different elemental ion and its corresponding temperature. They were all made on the same day by the EIT (Extreme Ultraviolet Imaging Telescope) on the orbiting SOHO spacecraft (Solar and Heliospheric Observatory). The original images were taken in the ultraviolet region of the electromagnetic spectrum, where wavelengths are shorter and frequencies are higher than the visible light region, and are artificially colored to distinguish between them. SOHO is a project of international cooperation between ESA (European Space Agency) and NASA.
top: 171Å
middle: 304Å
bottom: 195Å
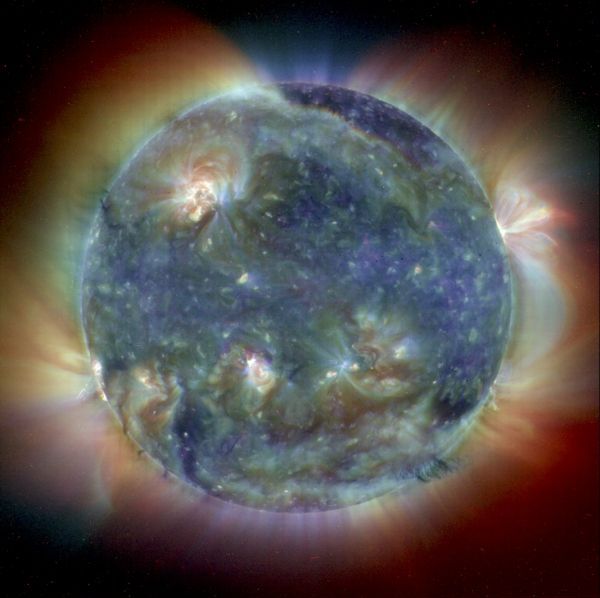
Tricolor Composite
This composite image combines EIT images from three wavelengths (171Å, 195Å and 284Å) into one that reveals solar features unique to each wavelength. Since the EIT images come to us from the spacecraft in black and white, they are color coded for easy identification. For this image, the nearly simultaneous images from May 1998 were each given a color code (red, yellow and blue) and merged into one.
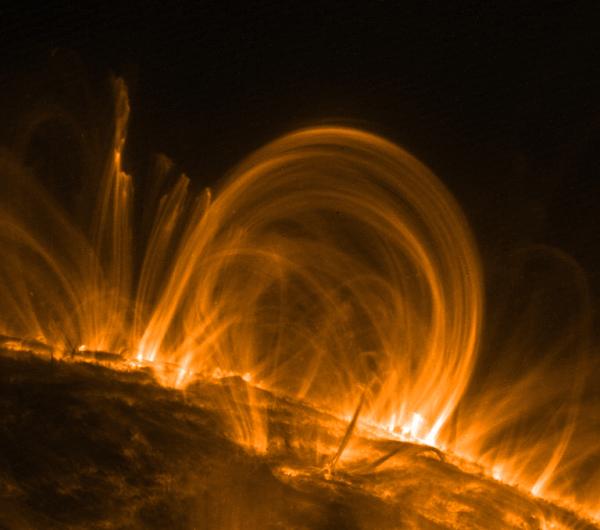
Coronal Loop Image
Fountains of multimillion-degree, electrified gas in the atmosphere of the Sun have revealed the location where the solar atmosphere is heated to temperatures 300 times greater than the Sun's visible surface.
Scientists discovered this important clue for solving the long-standing mystery of the hot solar atmosphere while observing the gas fountains (known as coronal loops) in unprecedented detail with NASA's Transition Region and Coronal Explorer (TRACE) spacecraft. Scientists are interested in the Sun's outer atmosphere, called the corona, because eruptive events occurring in this region can disrupt high-technology systems on Earth. Moreover, studies of the solar corona will help astronomers better understand other stars, which cannot be observed in as fine detail as the sun.
The new observations reveal the location of the unidentified energy source, showing that most of the heating occurs low in the corona, within about 10,000 miles (16,000 kilometers) from the Sun's visible surface. The gas fountains form arches (some more than 300,000 miles high and capable of spanning 30 Earths) as gas emerges from the solar surface, is heated and rises while flowing along the solar magnetic field, then cools and crashes back to the surface at more than 60 miles per second (100 kilometers per second). Millions of different-sized arches, called coronal loops, comprise the corona, and a 30-year old theory assumes that the loops are heated evenly throughout their height. The TRACE observations show that instead, most of the heating must occur at the bases of the coronal loops, near where they emerge from and return to the solar surface.
These images are false color pictures of ultraviolet light emitted by the hot gas that comprises the coronal loops. Ultraviolet light is invisible to the human eye, but detectable by the special instruments on board TRACE. White represents the brightest ultraviolet light.
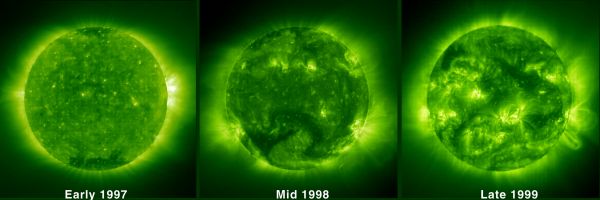
Increase in Solar Activity
A comparison of three EIT images almost three years apart illustrates how the level of solar activity had increased significantly during this period. The Sun reached its sunspot maximum of during this 11-years solar cycle in the year 2000. These images are captured using Fe XII 195 Å emissions showing the solar corona at a temperature of about 1 million K. Many more sunspots, solar flares, and coronal mass ejections occur during the solar maximum. The progression towards more active regions and the number/size of magnetic loops is unmistakable.
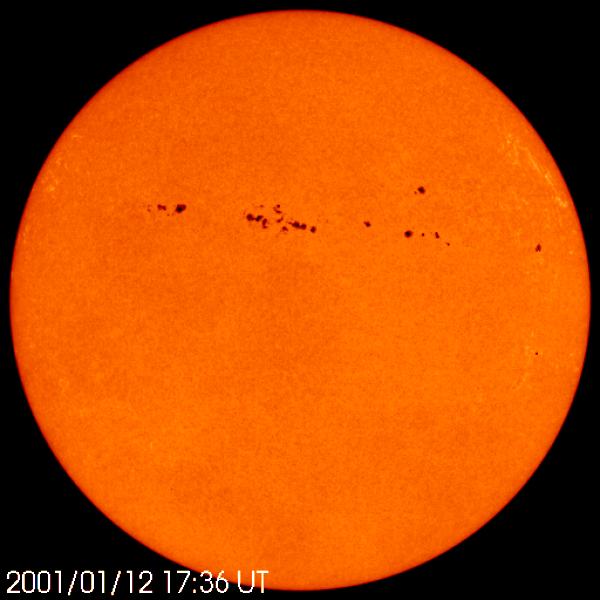
Sunspots
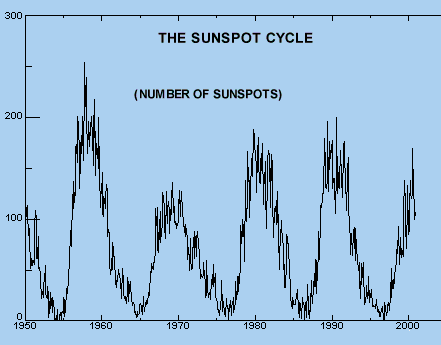
One way we track solar activity is by observing sunspots. Sunspots are relatively cool areas that appear as dark blemishes on the face of the sun and are formed when magnetic field lines just below the sun's surface are twisted and poke though the solar photosphere. The twisted magnetic field above sunspots are sites where solar flares are observed to occur, and we are now beginning to understand the connection between solar flares and sunspots.
The Earth is affected by both solar flares and sunspots. Solar flares emit high-speed particles which cause auroras, known in the northern hemisphere as the Northern Lights. Particles from solar flares can also disrupt radio communication, and the radiation from the flares can give passengers in airplanes a dose of radiation equivalent to a medical X-ray. Sunspots may have a long-term connection with the Earth's climate. Scientists are currently debating whether ice ages on Earth are related to the Sun having fewer sunspots than usual.

Magnetic Loops
Active regions and magnetic loops as recorded by EIT in the Fe IX/X 171Å line. The temperature of this material is about 1 million K in the lower corona.

Solar Prominence
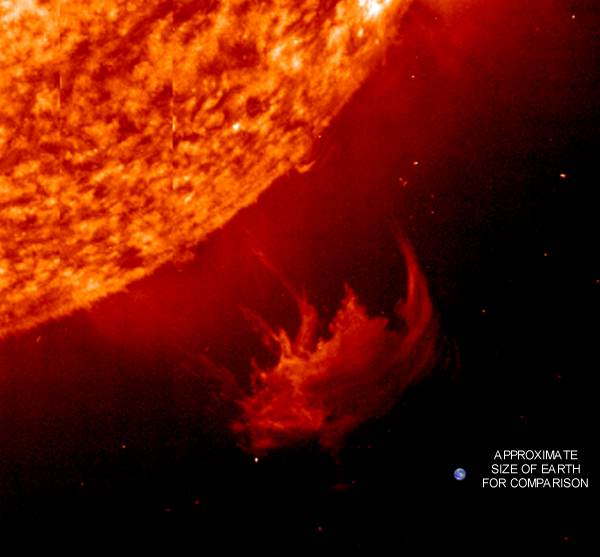
This is an EIT 304Å image of a huge, handle-shaped prominence taken on Sept. 14, 1999. Prominences are huge clouds of relatively cool dense plasma suspended in the Sun's hot, thin corona. At times, they can erupt, escaping the Sun's atmosphere. Emission in this spectral line shows the upper chromosphere at a temperature of about 60,000 degrees K. Every feature in the image traces magnetic field structure. The hottest areas appear almost white, while the darker red areas indicate cooler temperatures.
Sunquake
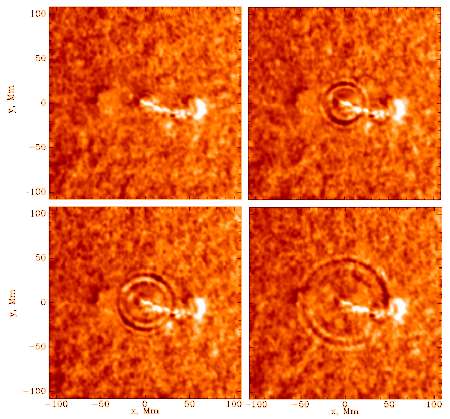
A rapidly expanding "solar quake" on the Sun’s surface depicted here by the Michelson Doppler Imager (MDI). It immediately followed a solar flare on 1996 July 6 and spread out more than 100,000 km at the solar surface. Scientists have shown that solar flares produce seismic waves, and gigantic seismic quakes, in the Sun's interior. They have tracked these seismic waves and found that "sunquakes" closely resemble earthquakes on our planet.
Coronal Mass Ejection
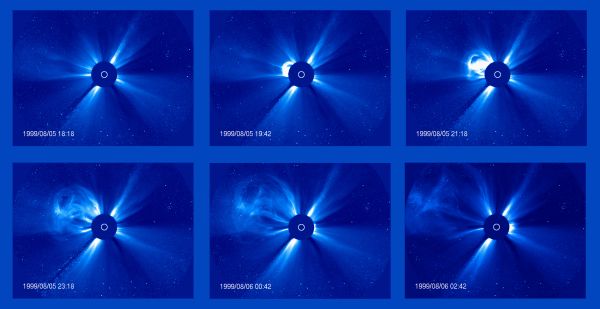
Progress of a Coronal Mass Ejection (CME) observed over an eight hour period on 5-6 August 1999 by LASCO C3. The dark disk blocks the Sun so that the LASCO instrument can observe the structures of the corona in visible light. The white circle represents the size and position of the Sun.
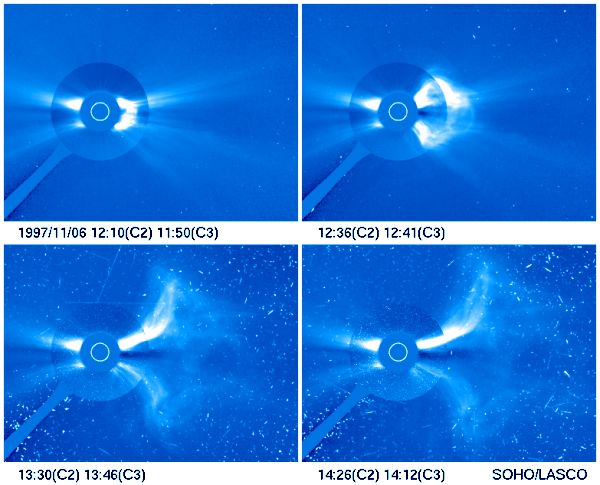
Coronal Mass Ejection and Proton Blast
LASCO C2/C3 composite image series showing a CME cloud emerging from the Sun and an ensuing proton blast that struck the SOHO instrument on 5 November 1998. Protons accelerated to 10% the speed of light arrived at SOHO in about an hour, causing numerous bright points and streaks in the last two images.
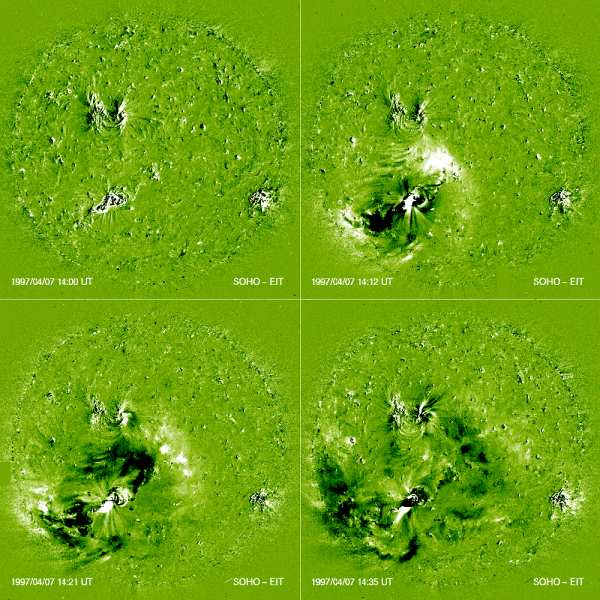
Moreton Wave from a CME
EIT observation of a Moreton wave expanding across much of the Sun’s surface. [Each image shows the full disc of the sun.] The wave was promulgated by a coronal mass ejection (CME) initiation site on 12 May 1997. This "running difference" imaging technique emphasizes the changes between successive frames. The wave front travels at speeds of about 300 km/s. These images were formed in the emission lines of Fe XII near 195 Å — this ion is formed at temperatures of about 1.5 million degrees.

Cutaway Illustration Showing Rotational Speeds
Solar rotation and polar flows of the Sun as deduced from measurements by MDI. The cutaway reveals rotation speed inside the Sun. The left side of the image represents the difference in rotation speed between various areas on the Sun. Red-yellow is faster than average and blue is slower than average. The light orange bands are zones that are moving slightly faster than their surroundings. The new SOHO observations indicate that these extend down approximately 20,000 km into the Sun. Sunspots, caused by disturbances in the solar magnetic field, tend to form at the edge of these bands.
 CosmicLight.com Home